plot hydraulics.
plot.hydraulic.Rdplot hydraulics.
Arguments
- x
an object of class hydraulic
- output_dir
character, path directory where output is saved. Default to current directory
- device,
character, defines way of plotting. Can only be one device at a time. If
displayis selected only one view can be shown at a time- view,
vector of character, defines which view shall be plotted Three options: "height", "discharge", "level"
- selection
vector, select the objects you want to plot either rooms or facades or openings
- ...
some extra parameters (unused)
Details
This is a new method for the plot function. It can be used to display graphs
or save graphs in different formats (.png and .pdf). The .png is in a
lower resolution than .pdf but is much lighter.
3 differents views are proposed:
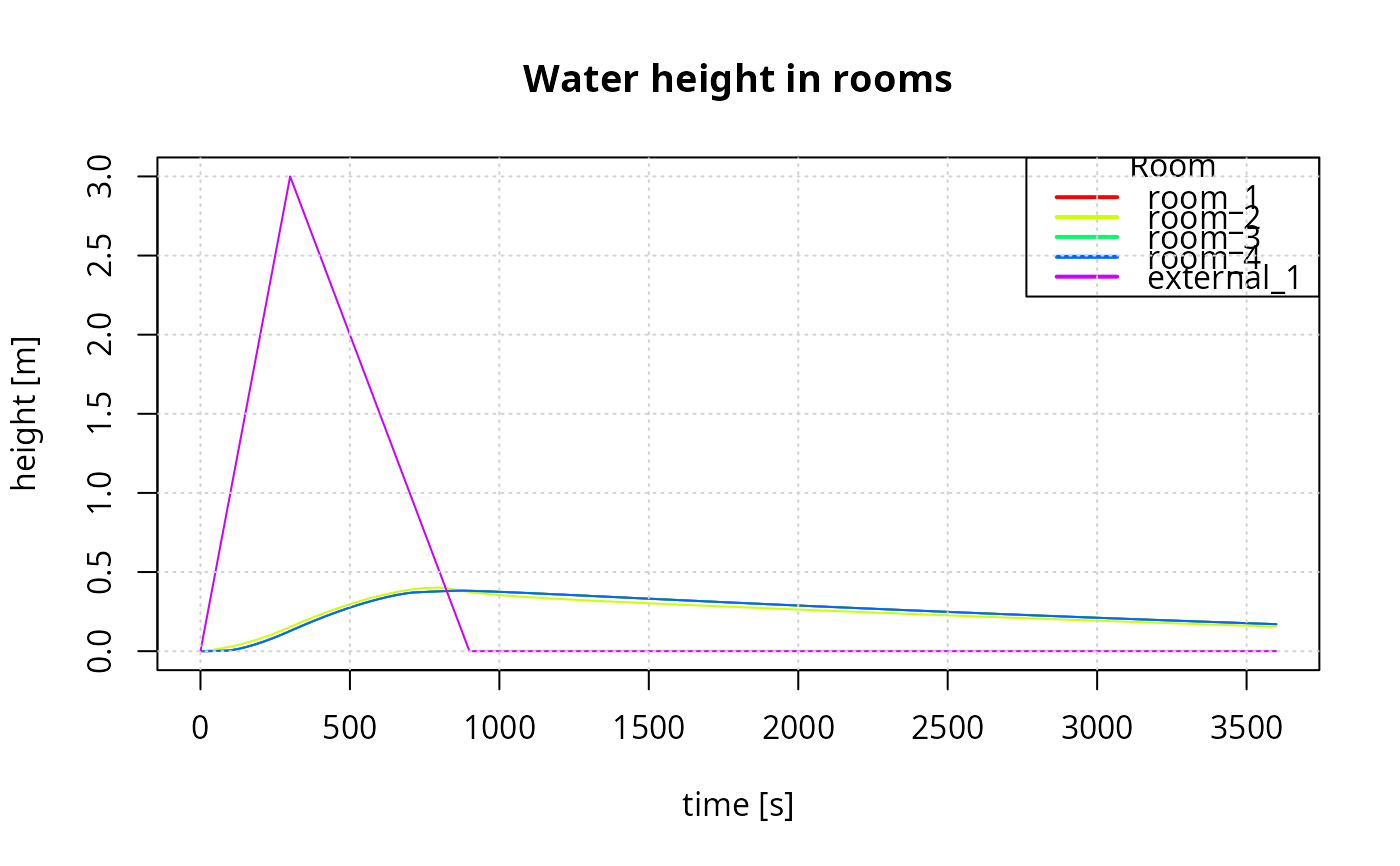
height: it represents the evolution of water height (m) for each room, the reference being the elevation of each room.
level: it represents the evolution of water height (m) for each room, the reference being the elevation of the whole model.
discharge: it represents the evolution of discharge (m³/s) for each opening.
Examples
# declaring input and output paths
model = adu_t

# generate limnigraph
flood = generate_limnigraph(
   model = model,
  time = c(0, 300, 900),
  depth = cbind(facade = c(0, 3, 0)),
  exposition = list(
    facade = list(external = c("wall_A", "wall_B", "wall_C", "wall_D", "wall_E",
    "wall_F", "wall_G", "wall_H")))
)
#> generating limnigraph ...
#>  limnigraph successfully generated

hydraulic = analyse_hydraulic(
  model = model,
  limnigraph = flood,
  opening_scenario = "close",
  sim_id = "test",
  stage = "hydraulic"
)
#> Simulating hydraulics for 'adu_t'...
#> 	... hydraulics successfully modeled for 'adu_t'
#> End of analysis for 'adu_t'. Total elapsed time 1.59 secs

plot(hydraulic)

plot(hydraulic, device = "png", view = c("height", "discharge"), output_dir = tempdir())
#> [1] "Water height view save in /tmp/RtmpLUNUWA/water_height.png"
#> [2] "Water height view save in /tmp/RtmpLUNUWA/water_discharge.png"