Get started
floodam-agri.Rmdfloodam.agri produces flood damage functions for
agricultural plots from in-depth expert knowledge on crop vulnerability
to hazard parameters (velocity, height, duration and seasonality).
This tool has been used to build the french national damage functions to the agricultural sector (Agenais et al. 2013 ; Brémond et al. 2022).
This vignette provides the basic steps to build a damage function to
an agricultural plot. For this example, we will build damage functions
for both greenbean and greenpea.
Declaring paths
The process starts by providing the input and output directories.
After loading the library, use init_path() to initialize
all the paths needed to obtain the damage functions.
To make things easier, floodam.agri is shipped with data
available in your library’s installation folder. In this example we will
use the inputs in the default folder which contains the
necessary inputs to build any available damage function which includes
greenbean and greenpea crops.
You will also need to provide a folder where the output of
floodam.agri can be stored (our example uses a temporary
directory):
#> Loading required package: floodam.agri
library(floodam.agri)

#> Setting up environment paths (inputs and outputs)
output = file.path(tempdir(), "get_started")
path = init_path(
  output = output,
  default = TRUE
)
For more information on the specifics and outputs of
init_path(), please refer to: Understanding path declaration with
init_path().
Preparing data
The next step is to read and prepare data needed to build the
available damage functions and store them in the output folder. Among
other things, this helps keep track of which inputs are used for each
simulation. The functions to be called are the following:
prepare_culture(), prepare_calendar(),
prepare_typology() and
prepare_action_value().
Run the chunk below to prepare data needed for building the damage functions.
#> Extracting damagement files to output
prepare_culture(path)

#> Extracting and copying calendars to output
prepare_calendar(path)

#> Building weight files
prepare_typology(path)

#> Preparing necessary action values and yields
prepare_action_value(path)
You can take a look at the prepared data in the output
directory.
As you can see in path[["output"]][["culture"]], all
available crops in the default folder have been prepared.
If you wish to limit the number of prepared crops, you will need to
specify the typo argument in
prepare_culture(), prepare_calendar() and
prepare_action_value(). This is covered in the vignette “Understanding inputs for
floodam.agri” which gives more information on the specifics and
outputs of these functions.
Building damage functions
The function calculate_damaging() builds damage
functions for the crops of the declared extent. By default,
culture is set to NULL in order to build
damage functions for all the crops that were prepared in the previous
step. Instead of building all possible damage functions, you can choose
to build damage functions for specific crops by specifying them in the
culture argument. In our example, we will set
culture to build the damage functions for
greenbean and greenpea.
For the purpose of our example, we will simplify the default flood
resolution so that the running time is shorter (generally 4 to 10
seconds per crop with normal settings). This is done by changing the
loaded global data stored in the LEVEL variable.
#> Simplifying LEVEL
level = LEVEL
level[["duration"]] = seq(0, 5, 1)
level[["height"]] = seq(0, 100, 10)
level[["week"]] = seq(2, 52, 2)

#> Calculating damage function
damaging = calculate_damaging(
  path,
  culture = c("greenbean", "greenpea"),
  level = level,
  update.hazard = TRUE,
  retrieve = TRUE
)
#> Update of culture damaging functions:
#>  Processing greenbean... Finished in 0.43 secs
#>  Processing greenpea... Finished in 0.42 secs
#> ... processed in 0.85 secs
Congratulations, you have built your first damage functions !
They are stored in path[["output"]][["damage"]]. By
default, three data.frames for each crop are saved:
- full/damage_
crop.csv- damage function and associated damaging rules
- sumup/damage_
crop.csv- total damage function
- sumup/damage-disaggregated_
crop.csv- total and disaggregated (yield, replanting, soil and material) damage function
As you can see in the table below which shows the disaggregated
result of calculate_damaging() for a greenbean plot, the
produced damage functions do not have any hazard parameters in them. The
hazard parameters associated to each row of these data.frames are
available in the data.frame
file.path(path[["output"]][["damage"]], "hazard.csv")
Disaggregated result of
calculate_damaging()
Combining damage functions
This step has the main purpose of associating the produced damage functions for each crop together with the associated hazard parameters.
#> Combine damage to new classification
combine = combine_damaging(
  path = path,
  damage.culture = damaging,
  retrieve = "total" # one of c("total", "yield.annual", "yield.differed",
  # "replanting", "soil", material")
)
#> Processing combinations of damaging curves...    ... Finished in 0.1634166 secs
combine_damaging() exports one combined damage curve for
each damage type
c("total", "yield.annual", "yield.differed","replanting", "soil", material").
They can be found in the following output folder:
path[["output"]][["combine"]]
In the table below is a glimpse of what the combine
object is: combined damage functions of “total” damage for all crops
selected in simulation and their associated hazard parameters.
Aggregating the damage functions
Finally, the raw damage functions can be aggregated by regrouping the
hazard parameters into classes with the aggregate_damage()
function. In this example we use the default aggregation parameters
which aggregate by season (winter, spring, summer, autumn), velocity
(light, middle, strong) and duration (short, middle, long, extra).
#> Aggregate damage
agg_damaging = aggregate_damage(
  path,
  damage_origin = "total" # default
)
The result is saved in path[["output"]][["combine"]]
under the name total.aggregate.csv because the damage type
that is aggregated by default is the total damage. Feel
free to run this function again by setting damage_origin to
one of
c("material", "replanting", "soil", yield.annual", "yield.differed").
The result is shown in the table below.
Basic visualisation
Aggregated damage curves
floodam.agri comes with a default visualisation function
called plot_aggregated_damage() which creates a plot of
aggregated damage.
#> Show plot
plot_aggregated_damage(
  path = path,
  damage = "total.aggregate", # default
  culture = "greenpea",
  current = "light", # default
  duration = c("short", "long"), # default
  legend = "include"
)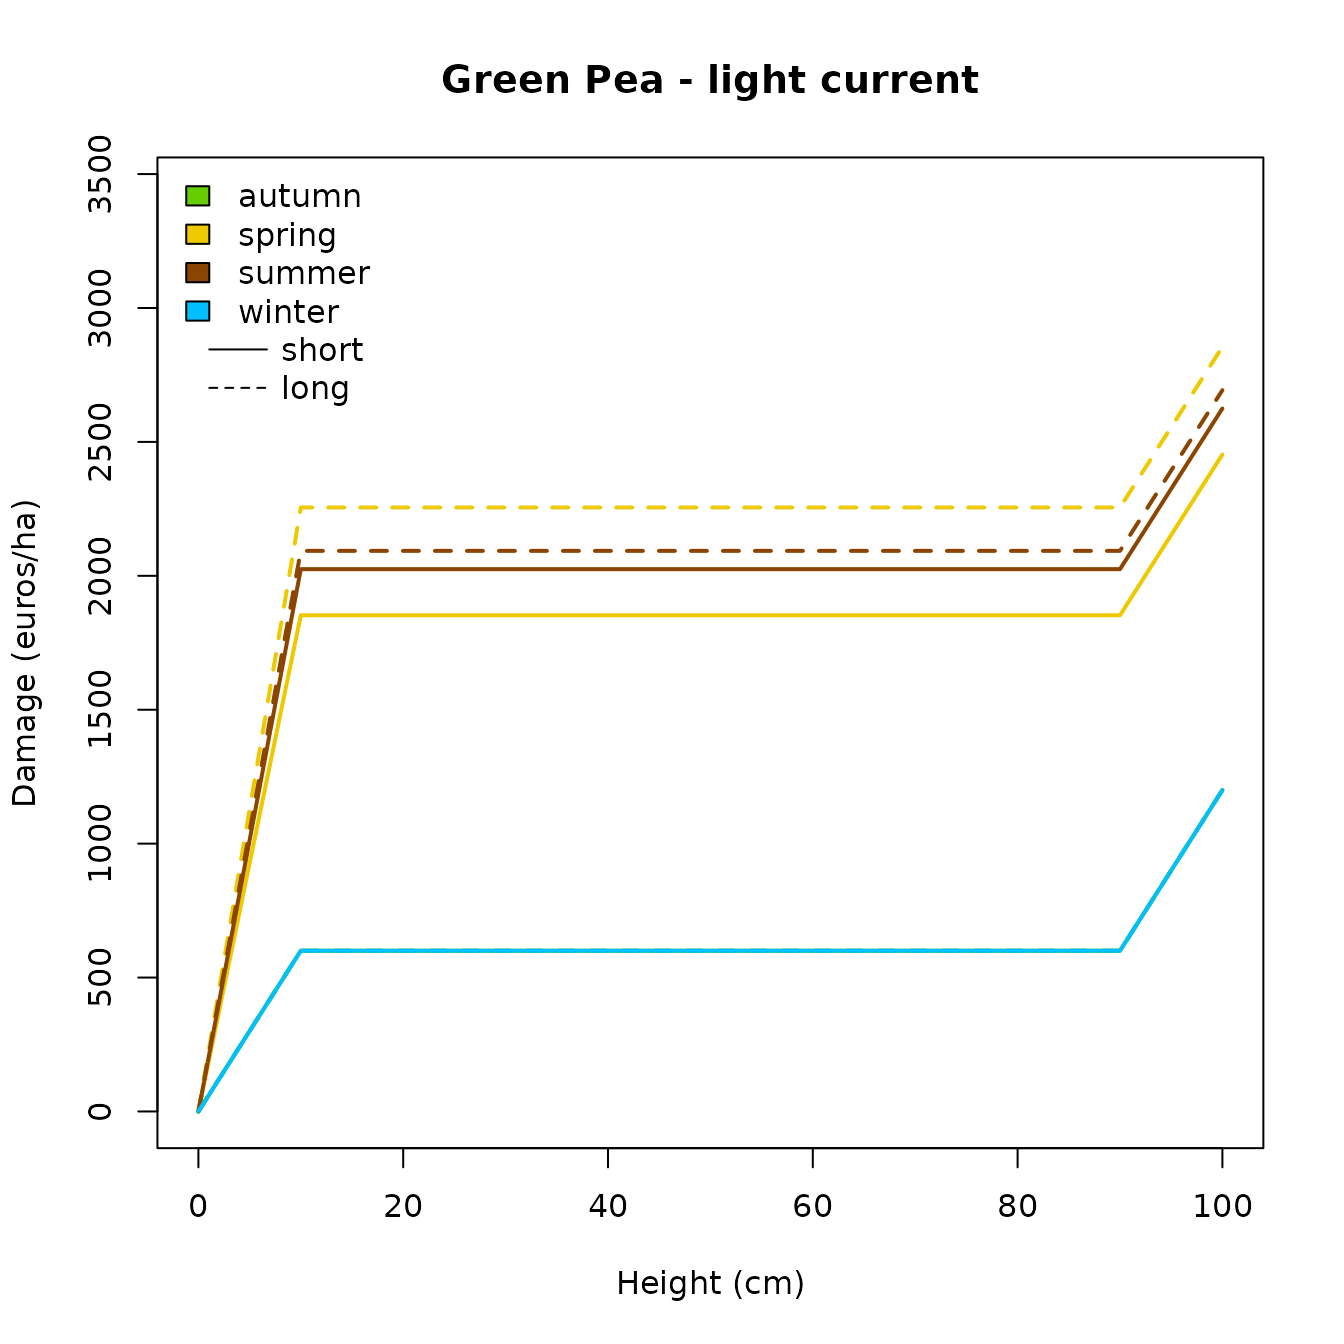
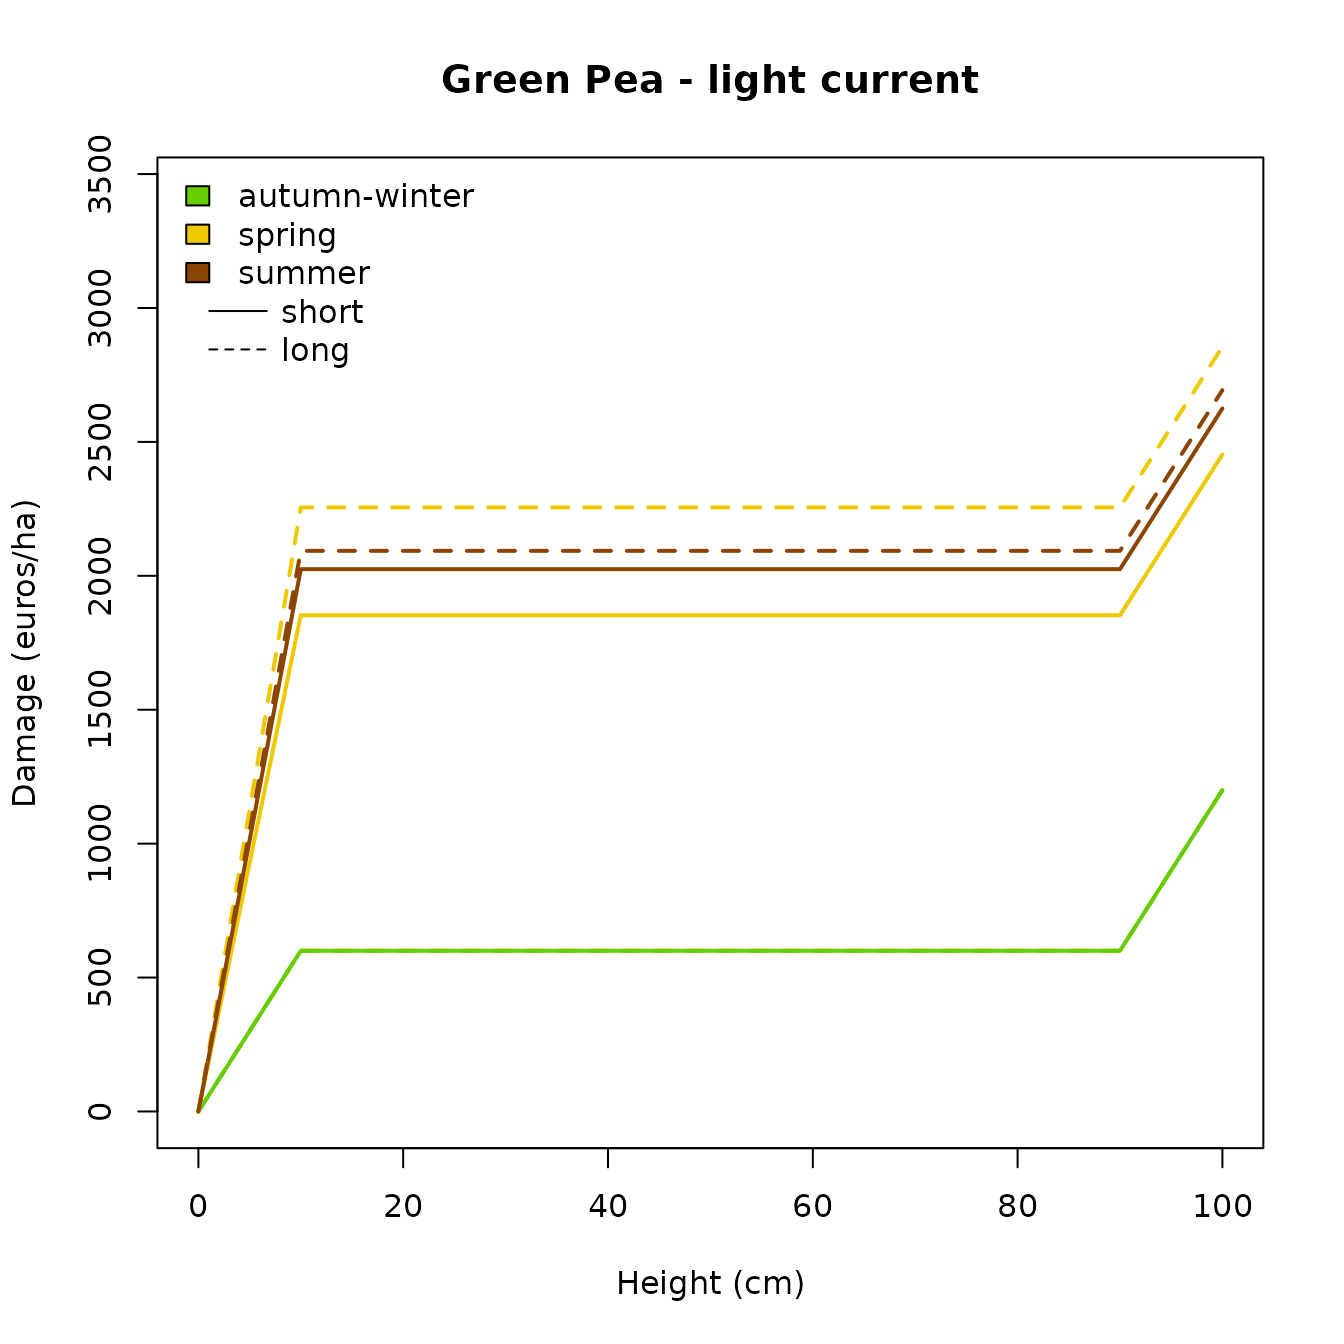
In our example, the damage curves for autumn and winter are equivalent which make them overlap one another. This is why we can not see the color for the “autumn” damage curve. A solution for optimal plotting of these specific damage curves could be done as shown in the chunk below.
HAZARD_AGGREGATE[["week"]] = data.frame(
  min = c(40, 14, 27),
  max = c(13, 26, 39),
  row.names = c("autumn-winter", "spring", "summer")
)
aggregate_damage(
  path,
  hazard_agg = HAZARD_AGGREGATE,
  damage_origin = "total" # default
)

#> Show plot
plot_aggregated_damage(
  path = path,
  damage = "total.aggregate", # default
  culture = "greenpea",
  current = "light", # default
  duration = c("short", "long"), # default
  legend = "include"
)
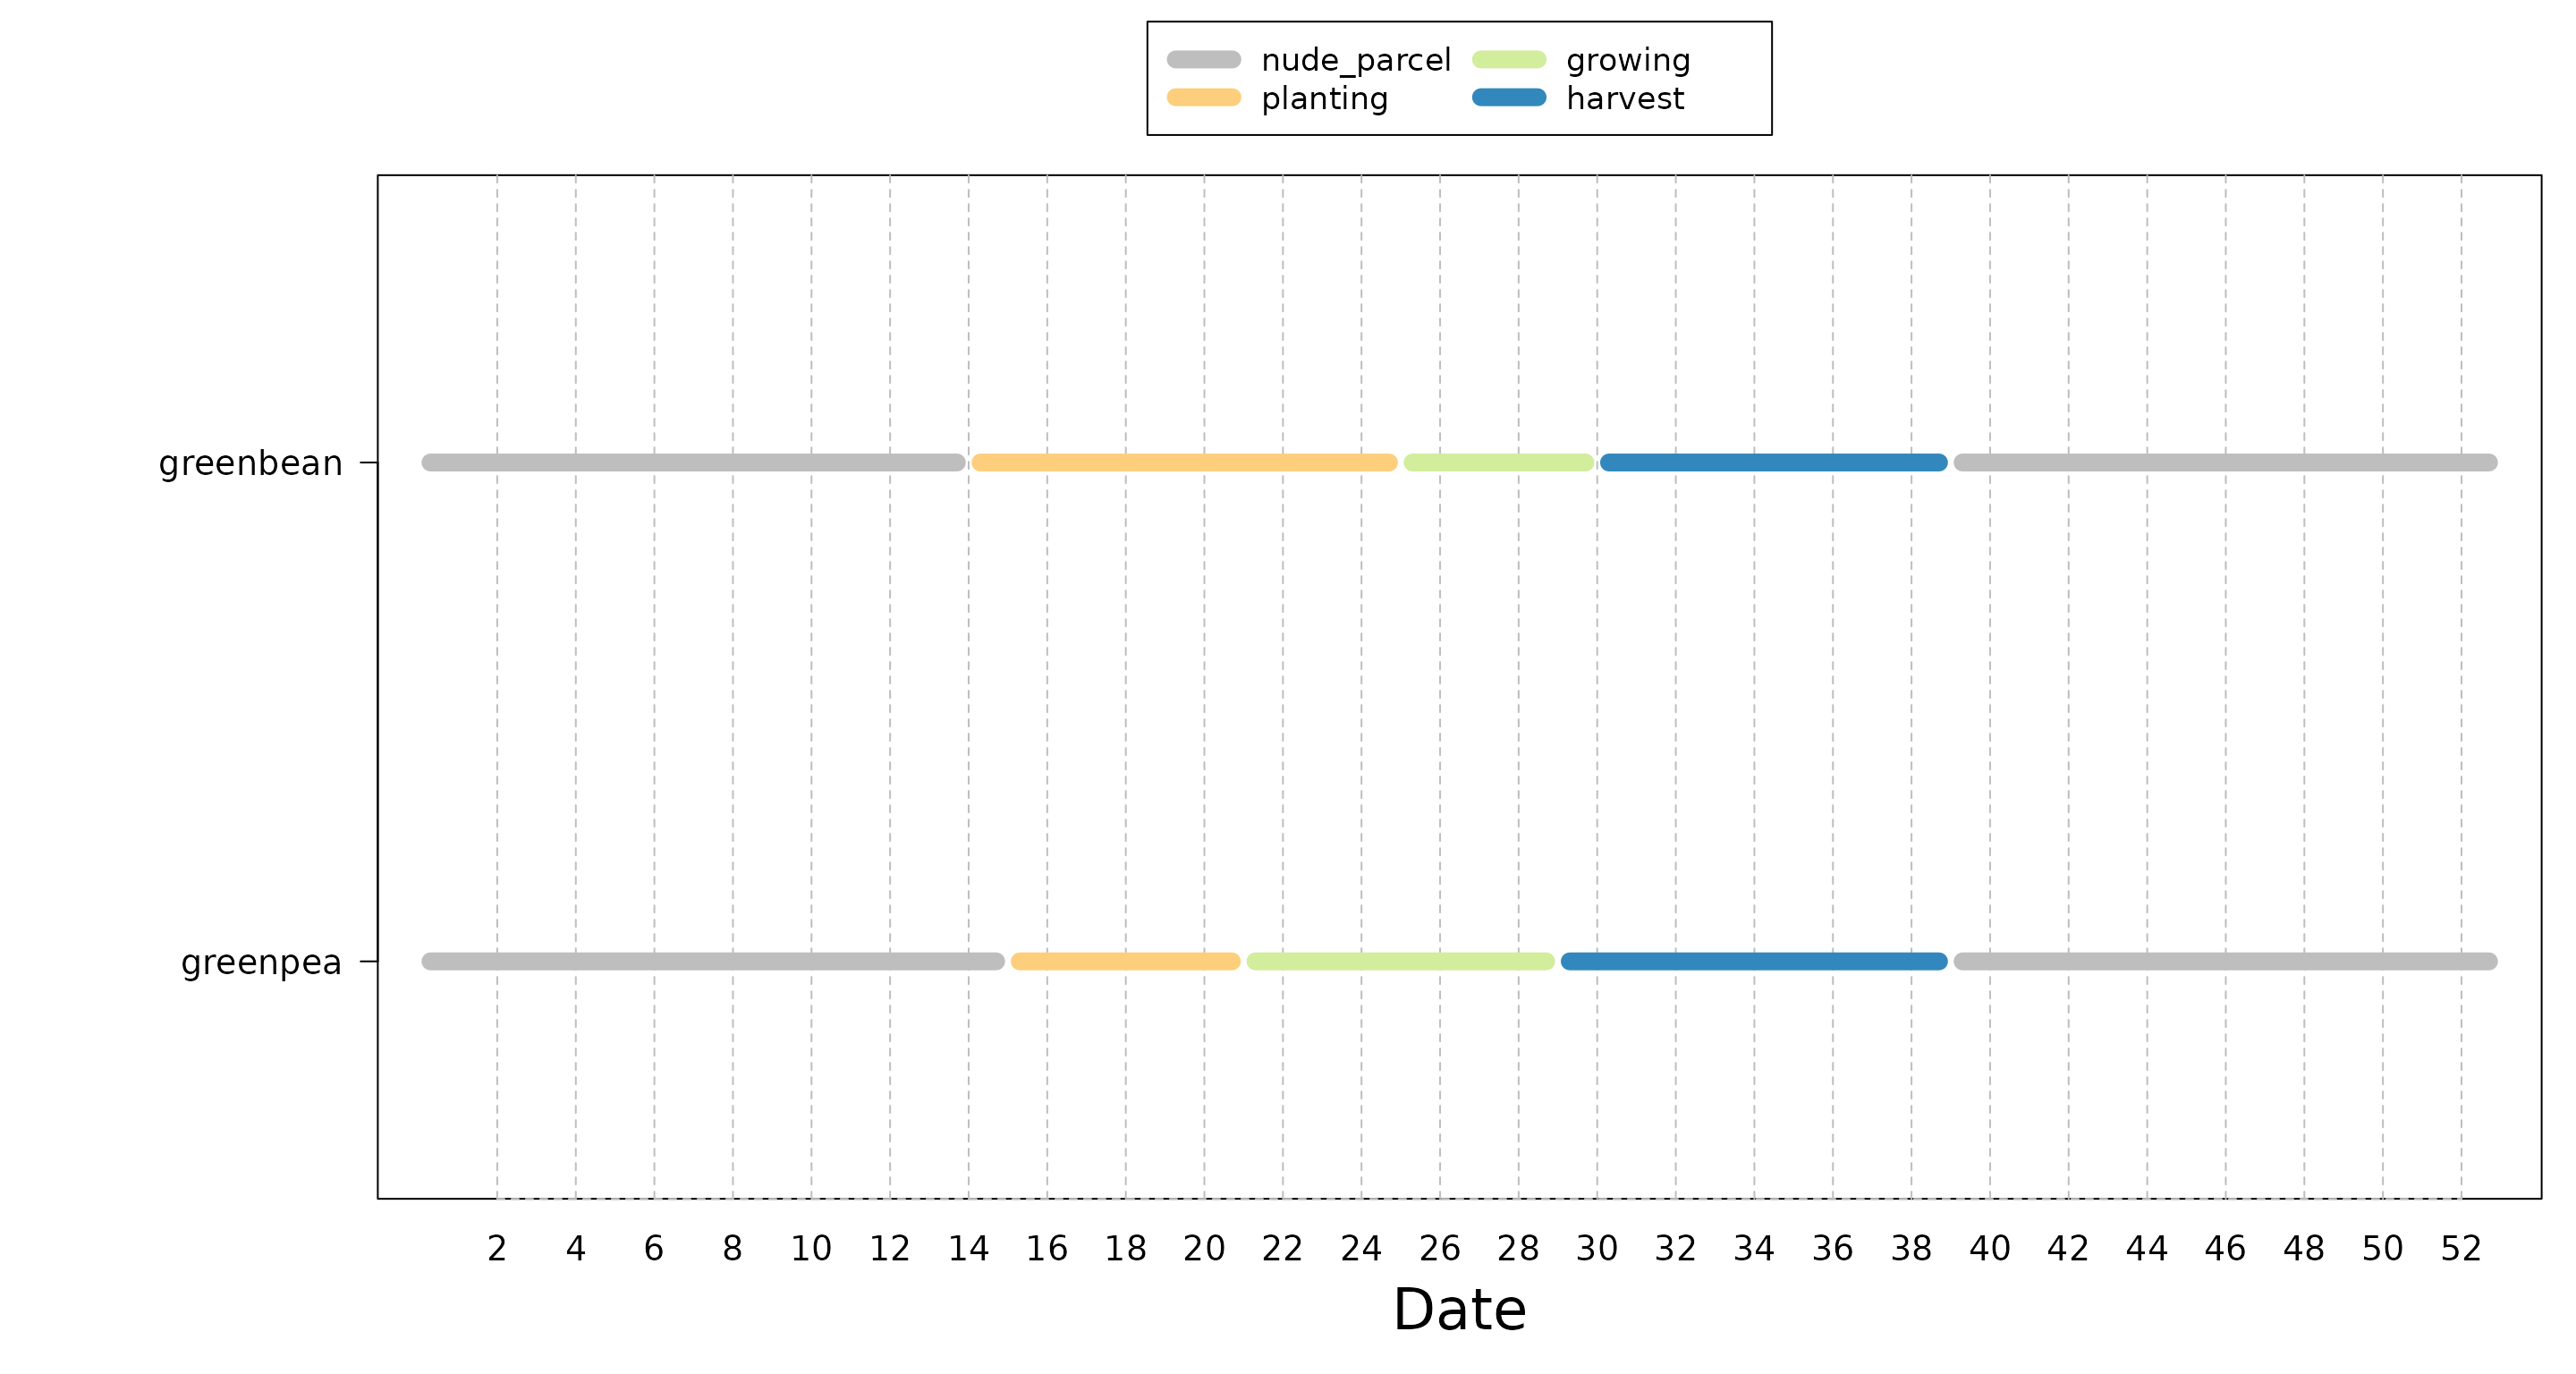
Crop calendars
floodam.agri comes with a default visualisation function
called plot_crop_calendar() which creates a plot of the
different physiological phases for a set of crops.
#> Show plot
plot_crop_calendar(
  path = path,
  culture = c("greenbean", "greenpea")
)
Learn more
The rest of the vignettes provide more information on several different aspects. Please check:
- How to build the french national damage functions to the agricultural sector with floodam.agri vignette to learn how to rebuild the french national damage functions to the agricultural sector.
More vignettes are to come. Stay alert !